 |
“One of the best courses that I have had in 17 years!” -Amy H
>> OREP E&O |
OREP/WRE Coronavirus Appraiser Blog
Coronavirus Appraiser Survey
Editor’s Note: This story is reprinted from the current print edition of Working RE magazine, mailing now. (Am I a Working RE Subscriber?)
Wisdom of Crowds and
a 108 Year Old House
By Scott Cullen, Solomon Adjustment Calculator
IIn January 2020, I completed an appraisal of a single family residence in an older part of St. Paul, Minnesota where I work as a Certified Residential Real Estate Appraiser. The subject is 108 years old, has newer siding and windows and fits well into the neighborhood. How did I appraise a 108 year old house? I used survey data and “the wisdom of crowds” theory.
This was not a “cookie cutter” assignment. There are no model matches, and after 100 years of occupancy and fighting the elements, there is wide variation in the condition of houses in the comp pool. After refining the comp pool, shooting exterior photos and viewing interior photos, I was ready to load the grid and work methodically toward an indication of value.
I used the depreciated cost method to develop adjustments for GLA, bath count, basement size, basement finish, porch and garage count. I used survey data as a basis for location, quality, condition and bedroom count adjustments.
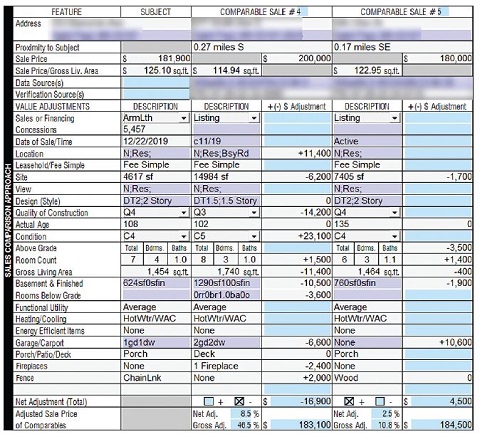
The properties shown are Comp 4 under contract at $200,000 and Comp 5 which was active at $180,000. Notice the adjusted sale prices of $183,100 and $184,500. The difference is $1,400 which is less than one percent. It seems as though the adjustments work together to explain the difference in the adjusted values of these two properties. I use the term “value” loosely because these are not closed sales. At the time these properties were on the market, buyers were paying 100 percent of original and final list price (Chart 1).

Chart 1: Click Here to See Full Size Image
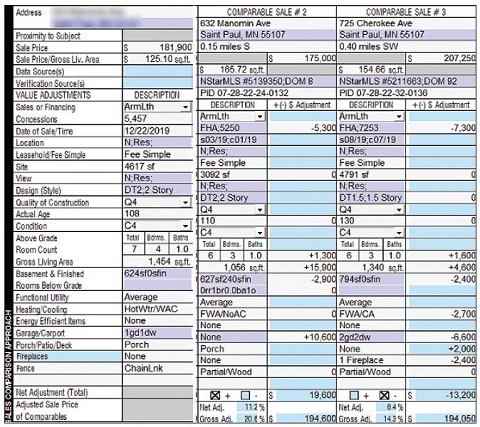
When we look at the closed sales used as Comps 2 and 3 we find similar results. I adjust seller concessions in this market because concessions never occur in cash transactions, and they frequently impact the offers that buyers make to sellers (Chart 2).
Chart 2: Click Here to See Full Size Image
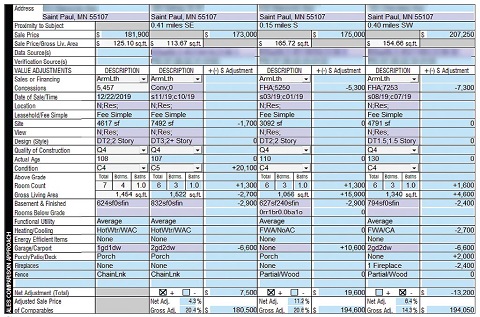
The only adjustments based on survey results are bedroom count. The reason they differ is that Comp 2 sold for $175,000 and Comp 3 sold for $207,250. As I state in the Summary of Sales Comparison Approach, “Other adjustments are developed from survey data as a percentage of sale price.” Prior to adjustment, the difference is $32,250 ($207,250 – $175,000). After adjusting for concessions, cost categories and bedroom count, the difference is $550—much less than one percent (Chart 3).
Chart 3: Click Here to See Full Size Image
Do these adjustment techniques always work this well? In a word, no. There is no perfect adjustment method. But the results are helpful in moving our analysis in the right direction. Here are the subject and Comps 1-3: the range of adjusted sold values is $180,500 to $194,050 or $13,550, which is over seven percent. The subject was under contract at $181,900 with concessions of $5,457.
In the Summary of Sales Comparison Approach I wrote: “GLA is reconciled between MLS and assessor data. Comps 4 and 5 are the most similar competing properties not adjusted for sales / list ratio per the attached MLS charts. Adjustments for building characteristics are developed with the depreciated cost method. See Adjustment Calculations and the Depreciated Cost Adjustments summary attached. Other adjustments are developed from survey data as a percentage of sale price. The opinion of value is developed within the range of adjusted sales price of the comparables at the level of support found in the competing listings.”
If the adjustments worked perfectly, all five comps would have adjusted to the same number. My opinion of value was $183,000, low in the range, but supported by the currently competing comps which adjusted to $183,100 and $184,500.
Survey Data
In their book Survey Methodology – Second Edition (John Wiley & Sons, Inc. 2009), the authors describe how the Bureau of Labor Statistics (BLS) gathers, analyzes and disseminates two numbers that reverberate through the economy. On the first Monday of each month, the BLS releases the unemployment rate and jobs count. Within an hour, trillions of dollars move in and out of markets around the world because decision-makers believe numbers that are based upon survey data.
Survey Methodology was written to address the question of when survey data is credible and when it is not. It is my goal to apply credible survey methods to the field of residential appraisal.
I used survey results and depreciated cost adjustments to narrow the range of adjusted values. Together they work well to move us toward a well-supported opinion of value. Over the past two years I have had similar results time after time to the extent that I want to tell the story of developing sales grid adjustments with survey results.
The Wisdom of Crowds
My interest in the survey method began with a television program called Brain Games. As I watched with my two youngest children, 20 volunteers were asked to estimate the number of gumballs in a large gumball machine. Their estimates were recorded, totaled and divided by twenty. The estimates range was from 100 to 11,986. The average of all the estimates was 2,425 gumballs.The actual number of gumballs was 2,447 which is within one percent.
This got me interested in learning more about a phenomenon called the Wisdom of Crowds. The best presentation I have seen is by Marcus du Sautoy, a British mathematician, author and public advocate of science and mathematics. His credentials include the Simonyi Professorship for the Public Understanding of Science at the University of Oxford. His five-minute video was produced by BBC. (Visit www.WorkingRE.com/wisdom to watch the video.)
Du Sautoy tells the story of Sir Francis Galton and his discovery of what has become known as Wisdom of Crowds. Galton’s contributions to science are far reaching so we will focus on only a few in the field of statistics.
Questionnaire: Galton was the first to use a questionnaire to document survey results.
Standard Deviation: The concept that two sets of data may have the same mean value, but could differ in their variation around that mean.
Regression: Galton was first to use the regression line and chose the letter “r” to represent the correlation coefficient.
The Wisdom of Crowds: The setting for Galton’s discovery was a livestock fair. An ox was on display and people were buying tickets to enter a contest to guess the weight of the slaughtered ox carcass.
Estimates of the weight were written on the tickets. The tickets were seen by Galton as a survey questionnaire. The idea of the contest organizer was to award the prize to the person who most closely estimated the actual weight of the carcass.
Galton had a different idea. He had a scientific experiment in mind for the tickets. He wanted to prove that commoners were not able to guess the weight of an ox carcass, much less manage the affairs of society. The politics of Elizabethan England included debate about preserving the monarchy in a world that was seeing the emergence of democracy. He proved his hypothesis. Nobody could estimate the weight of the carcass. But Galton was a scientist who didn’t end his inquiry when there was the possibility of learning more from the results of the survey. His analysis showed that the “middlemost estimate expresses the vox populi” (voice of the people). Every other estimate was either too high or too low, as judged by the majority of those who participated. Middlemost is another way of saying median, which is a term also originated by Galton.
The middlemost estimate was 1,207 pounds. The actual weight of the ox carcass was 1,197 pounds. This is within one percent. Upon further analysis, Galton found the mean of all tickets to be 1,197 pounds. Zero error! I have tried to follow Galton’s example of Wisdom of Crowds to develop survey-based adjustments for features unrelated to cost such as bedroom count and influences, such as busy road, backing to a freeway, power lines, rail tracks and pipeline right of way. I have to admit that I want the survey method to work. It saves lots of time in the appraisal process. To guard against bias, I want to remember this quote from the Bureau of Labor Statistics website.
“Is the glass half empty or half full? At BLS we see an eight-ounce glass containing four ounces of fluid.”
In keeping with this quest for objectivity I have studied the work of James Surowiecki. In his book “The Wisdom of Crowds,” Surowiecki lists four conditions that characterize wise crowds. Each of these conditions must be met in order to have credible survey results.
“The (stock) market was smart that day because it satisfied the four conditions that characterize wise crowds: 1) diversity of opinion (each person should have some private information, even if it’s just an eccentric interpretation of the known facts), 2) independence (people’s opinions are not determined by the opinions of those around them), 3) decentralization (people are able to specialize and draw on local knowledge), and 4) aggregation (some mechanism exists for turning private judgments into a collective decision).
If a group satisfied those conditions, its judgment is likely to be accurate. Why? At heart the answer rests on a mathematical truism. If you ask a large enough group of diverse, independent people to make a prediction or estimate a probability, and then average those estimates, the errors each of them makes in coming up with an answer will cancel themselves out. Each person’s guess, you might say, has two components: information and error. Subtract the error and you’re left with the information.”
Diversity of opinion, independence, decentralization and aggregation. These are the four characteristics at the core of the surveys I have originated over the past few years. The aggregation mechanism is a website designed for this purpose called PeerConsensus.com. Presently, the website archives a wide range of surveys of appraisers. The results have been very useful to me and hundreds of others. But it would be more credible to have surveys of market participants like agents.
I cannot imagine a more willing survey participant than the listing agent who gives you access to the house you have been assigned to appraise. You are their new best friend in the real estate business! At least long enough for them to fill out a quick survey.
Over time, my hope is to develop surveys of real estate agents. Localized surveys will become possible as participation grows. Growth depends upon the usefulness of the survey results and how many people are helped by them. I believe that Galton’s example can be useful, just as his other innovations have proved to be: median, standard deviation, regression, and the questionnaire. All from the prolific mind of Sir Francis Galton.
>> Upcoming Two-Part Webinar:
Condition Adjustments: How the Cost Approach Helps
“This was my first time to listen to one of Richard Hagar’s courses and I wish I had done so much sooner! Very valuable info and easy to understand.” -RM
>> Join the Discussion at OREP/Working RE’s Coronavirus (COVID-19) Discussion and Resource Page/a> where you can share your thoughts, experiences, advice and challenges with fellow appraisers.
>> Take OREP/Working RE’s Coronavirus: State of the Appraisal Industry survey here.
About the Author
Scott Cullen is a Certified Residential appraiser from Eagan, MN who is a partner in the development of the Solomon Adjustment Calculators, designed to quickly evaluate the tradeoffs encountered by residential appraisers, including the depreciation / site value dilemma. There is a free 14-day trial and you are welcome to contact me for a demo over the phone using live examples from your market: www.solomonappraisal.com.
Sign Up Now! $119 (7 Hrs)
OREP Insured’s Price: $99
>Opt-In to Working RE Newsletters
>Shop Appraiser Insurance
>Shop Real Estate Agent
Insurance
Send your story submission/idea to the Editor:
isaac@orep.org


