


 |
> The Appraiser Coach > AMC Resource Guide > OREP E&O |
Fannie, Freddie: New Market Analysis Requirements February 4th
by Isaac Peck, Publisher
Fannie Mae and Freddie Mac (the GSEs) have not so quietly published new requirements for appraisers that will be effective February 4th, 2025. Lenders have been encouraged by the GSEs to “implement these policy changes” immediately, but face a hard deadline for the requirement implementation in early February.
So just what are these new requirements for appraisers?
According to Fannie’s Selling Guide Announcement (SEL-2024-07), appraisers will be required to:
- Establish a minimum timeframe of 12 months from which the overall market trend must be derived;
- Identify that the overall market trend may be different from the adjustments applied to individual comparable sales;
- Report the market analysis that supports both the indicated overall market trend and market derived time adjustments for changes in market conditions.
Here are some of the details behind these new requirements.
Adjustments
At the heart of the new GSE requirements is the idea that appraisers need to provide additional analysis of the market and make time adjustments (or not) based on what the market indicates.
Of course, the GSEs pushing appraisers to provide support for their adjustments is nothing new. The GSEs have been critical of appraisers making adjustments (or not making them) in an unsupported and indefensible way—for at least the last decade. For example, Fannie Mae indicated that adjustments were one of the most important things an appraiser should calculate as far back as 2015 and 2016.
Why Time Adjustments?
The GSEs specific calling out of time (i.e. market trend) adjustments, and incorporating it into their Selling Guide, raises the question: what makes time adjustments so special?
Will Fried, Chief Innovation Officer True Footage, believes that this singling out of the time adjustment suggests this is likely the single most important adjustment to the GSEs.
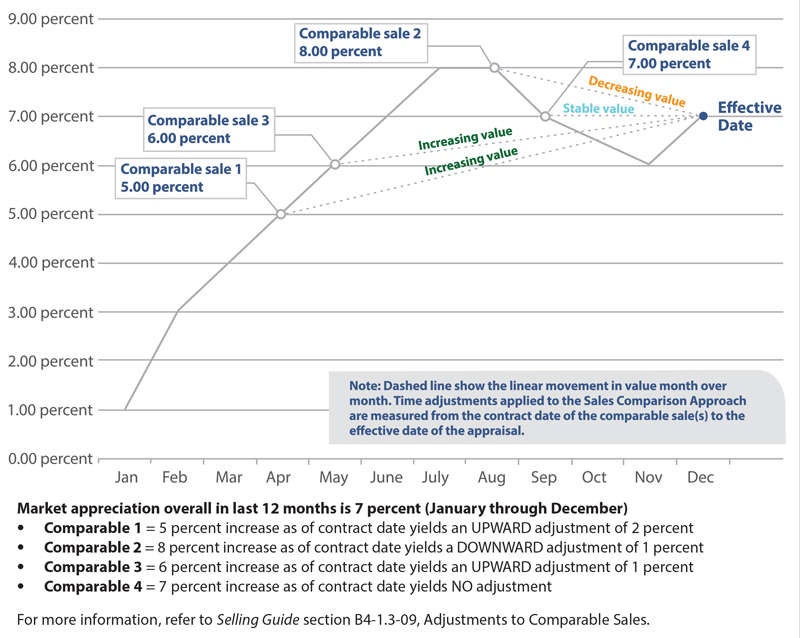
Figure 1: Fannie Mae Negative Adjustment Example
The backdrop of this new requirement is how appraisers made time adjustments during the COVID-19 “boom” years of 2020 through 2022, Fried says. “During the COVID–19 years when most markets were seeing over 20 percent appreciation Year-over-Year (YoY), appraisers were only making adjustments 20 to 25 percent of the time,” says Fried.
In a webinar with George Dell back in 2022, Scott Reuter, Chief Appraiser at Freddie Mac, explained that appraisers’ lack of market conditions adjustments creates a lack of credibility in their reports. “A couple of highlights and what we were seeing was that the amount of time that appraisers were making this adjustment, even trying to develop a market condition or time adjustment, was maybe 20–25 percent of the time, and appraisers appear to be very conservative even when they were developing the adjustment,” Reuter says.
By conservative adjustments, Reuter is referring to situations where a full market analysis might lead Freddie to expect an appraiser to make a six percent time adjustment, but the appraiser only applies a one percent adjustment, for example.
(story continues below)

(story continues)
Non-Linear Adjustments
One of the more nuanced facets of the GSE requirements is that in addition to accurately capturing how a given market has changed over the last 12 months, appraisers will also be expected to make non-linear adjustments based on how the market has changed, Month-by-Month, since a given comparable might’ve been sold.
“The vast majority of time, the market does not change in a linear fashion. So just looking at strictly Year-over-Year market changes means we might miss out on the full picture: seasonality, the sharper price appreciation in the spring and summer, the dip and market slow-down in the fall or around Christmas time, and so on,” suggests Fried.
In other words, the GSEs are requiring appraisers to go beyond reporting a flat 12-month trend appreciation percentage, versus what the actual change is in the last four months, for instance. Here’s an example: Let’s say the market has been appreciating 15 percent YoY in the last 12 months, and the appraiser is using a comparable that was sold four months ago. Traditionally, an appraiser might take that 15 percent appreciation, divide it by 12, and multiply by 4. (15% / 12 = 1.25% average appreciation per month X 4 months).
However, this example assumes linear appreciation over a 12-month period. But markets generally do not appreciate in a linear fashion. Using the same example above, if the appraisal’s effective date is December 31st and the appraiser is using a comparable sale that closed September 1st, it’s possible that the market has actually declined in the last four months, even though the YoY appreciation for the last 12 months is 15 percent. (The market might’ve increased by 20 percent from January 1 through August 31, then declined five percent from September 1 through December 31, for example.)
This means that appraisers will now need to accurately (A) define the market, (B) determine the 12-month trend and how pricing has been changing, and (C) isolate the specific non-linear, Month-over-Month change for each comparable. This will make time adjustments more complicated and potentially more time consuming, unless an appraiser has a tool it can use to isolate these numbers.
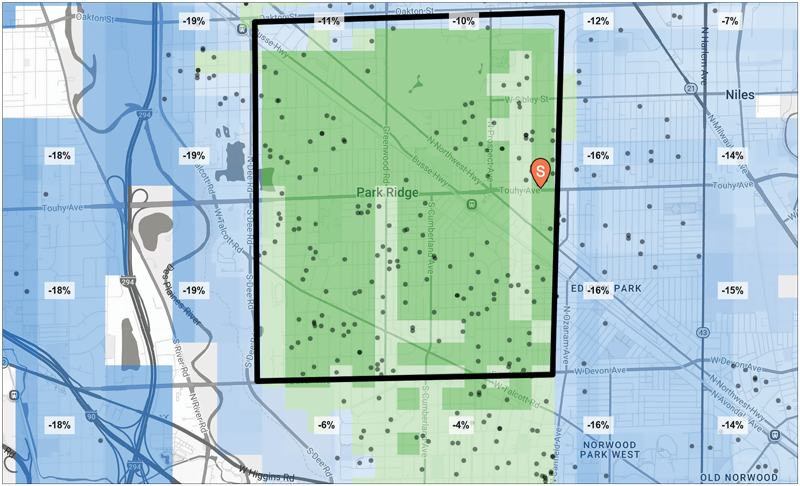
Figure 2: Heatmap showing neighborhood boundaries by price differences
Data Driven
Sometimes the data will show that the adjustment should be linear, and sometimes it’ll be non-linear, according to Fried. Sometimes the data will show that the market is stable and no adjustment is needed at all. It will all come down to the data. “Even if the market has been going up, the appraiser might still need to apply a negative time adjustment. Just look at the Fannie Mae graph example. It is going to be data driven. Appraisers will need to include an explanation for why adjustments were made and why they weren’t made. So appraisers will need different adjustments for different comps—depending on when the comps closed,” reports Fried. (See Figure 1: Fannie Mae Negative Adjustment Example.)
What Are Appraisers to Do?
This latest change to the GSEs’ Selling Guide is one of the most specific requirements that have been put on appraisers, especially as it relates to adjustments.
Some appraisers may try to use spreadsheet programs like Microsoft Excel to import data from their Multiple Listing Services (MLS) and then manually manipulate the data to create graphs and answer specific questions about each comparable.
Alternatively, appraisers will search to find tools that will help them answer these types of market analysis questions that will meet the GSEs’ requirements.
This is where the TrueTracts platform comes in. TrueTracts is a software platform that Fried has been developing specifically for appraisers to address the GSEs’ requirements.
There is currently a shortage of tools for appraisers to use for this purpose, according to Fried. “Many of the tools that are available to appraisers right now will only provide linear adjustment data, or will provide quarterly data, like Q1, Q2, and Q3, for example. The problem is that it is bucketing into quarters and not providing enough granularity. There’s not a way to make an adjustment from October to December,” says Fried.
The result, according to Fried, is that appraisers will now need to spend considerable time manually analyzing and extracting a non-linear adjustment out of the data, or they’ll find a tool that will help them do this. “Appraisers will need software that enables them to determine where this non-linear trend is. They’ll also need more data because you need sufficient data to figure that out. You have to have both components,” says Fried.
In terms of data, appraisers will face big challenges finding enough data to provide the market trend analysis the GSEs are looking for, especially in small, less active, or more rural markets.
Having a tool that can look outside of the subject’s current market and identify comparable markets, such as nearby towns, neighborhoods, etc. that have similar pricing, similar property features, and so on will be important, according to Fried. “Appraisers are often stuck trying to analyze a small amount of data inside narrow market boundaries because they don’t have a data driven way to justify broadening their search and including data from nearby markets,” says Fried.
Here, TrueTracts is able to identify comparable markets and neighborhoods to the subject neighborhood based on things like property features, type of construction, age of construction, pricing, and so on, so appraisers can then have enough data to properly analyze the market and report more accurate data as it relates to market trends and time adjustments.
TrueTracts also includes dynamic and easy to use heat maps that appraisers can use to easily identify and select data as they slice and dice what they want to include in their analysis (See Figure 2: Heatmap showing neighborhood boundaries by price differences).
>> For appraisers who are interested in learning more about TrueTracts, visit True Footage online at: https://true-footage.tech/tools/truetracts.
>> Paul Rowe, National Director at True Footage, will also be presenting a webinar TOMORROW (1/30) at 10 a.m. PT. If you’re interested, you can sign up here.
About the Author
Isaac Peck is the Publisher of Working RE magazine and the President of OREP, a leading provider of E&O insurance for real estate professionals. OREP serves over 10,000 appraisers with comprehensive E&O coverage, competitive rates, and 14 hours of free CE for OREP Members (CE not approved in IL, MN, GA). Visit www.OREP.org to learn more. Reach Isaac at isaac@orep.org or (888) 347-5273. CA License #4116465.
OREP Insurance Services, LLC. Calif. License #0K99465
by Salvato
This industry has taken a drastic turn in the last 15 years. We will have more AI doing a vast majority of Appraisals where the avg hard working Appraiser is getting forced out of the system due to more work and liability and less fees paid. The only survivors will be Mng Co, Tech Comp and those few who are involved in the consulting webinar instructor portion of the business. The main goal for FNMA is to simplify and Appraisal report and utilized Appraisers as basic foot soldiers to gain information and data for AI. Soon the Appraiser will be distinct. We as Avg Appraisers need to form a backbone, unionize, remove the scam Mngt Co, demand the full fee or this will be just a part time job with no benefits. The industry is imploding. Preparing for a new job.
-by Frances
Sound like someone is making $$$$$$ selling his software for this! TrueTracts is a software platform that Fried has been developing specifically for appraisers to address the GSEs’ requirements.
-by FRED VANDER WAL
totally agree with the above 2 comments. I can show in certain areas within a 1 mile radius appreciation of 4% or 20%. Every source is an average. go ahead waste your time adding 15 graphs. they are worthless AND MISLEADING!
-by Masaka Lingl
Yes completely agree, this is a waste of time money and increases liability…Nobody benefits!
-by robertjones0556@gmail.com
Why is this course not given credit hours in Georgia? Thank you!
-Robert M. Jones dba Robert Jones Appraisal Practice
robertjones0556@gmail.com
by Clayton Boyd
The graph and explanation shown within the article is both extremely inconclusive and certainly promotes the OPPOSITE of clarity and refinement. The graph shows “cherry picked” comparable sales and then utilizes them to define the overall market. There is absolutely no data to support the “time adjustments” and the data given does not support the adjustments within the article.
-by Clayton Boyd
Also…. Mr Fried has the misconception that time adjustments should not be linear… but the whole CONCEPT of time adjustment is based on a timeline… which is linear. You cannot adjust based on “spot locations”… such as ‘one community in the competing neighborhood has a 15% increase while the nearby one has a 10%.. and have that data based only upon one or two sales per month in those neighborhoods. NO. Mr Fried needs to go back to Appraising 101 class.
-